

Want to know about E.A.R.L.'s Journey to 900? The formation of the idea and what we learned during the first season? You'll want to check out my first blog - The Technician.

Chasing 900
The Idea
E.A.R.L. achieved a perfect game early in his tenure at the International Training and Research Center. However, rolling a 900 was never attempted and thought of as impossible. There are less than 40 out of millions of bowlers to have ever achieved this honor.
Think about that for a second. Thirty-five perfect sets. How many sets are bowled in a year? Let’s figure there are 1,400,000 bowlers that bowl in USBC-certified competition. Let’s also assume they all bowl in only one league, three games per night. That means that each and every week, there are 4,200,000 games bowled, making up 1,400,000 three-game sets. This is an underestimate because we know about a third of you wonderful people bowl more than once a week. Nonetheless, it will give us a good starting point. A total of 1,400,000 sets over 35 weeks per season gives 49,000,000 opportunities to roll 900 every year. If one were to imagine rolling that back to the beginnings of ABC in 1895, there could be as many as 6,076,000,000 series, which would put the odds of any given bowler shooting 900 at 1 in 164,216,216. So, if you’re up to the challenge, go bowl a half billion games, and you might shoot 900!
The Plan
It started with a thought: “Hey, wouldn’t it be cool if we could time-lapse the robot shooting 900?” The obvious answer was yes, of course that would be cool. At first I pitched it as setting up a camera and throwing 3 games a week during our lunch hour, but the team saw an even better opportunity to help educate the masses on ball selection and lane play. Before we knew it, the plan had become a full 17-episode run for perfection.
Each episode consists of a three-game set bowled by E.A.R.L. At first, we were open to using any parameters E.A.R.L. could use, but in the interests of keeping it realistic, we limited him to the styles of different professional players. We even had some guest stars come in to “drive” E.A.R.L. and tell us what moves to make. It was an amazing chance to really see what E.A.R.L. can do.
The Action
There were so many amazing moments filming this series, it’s hard to limit the discussion to just a few episodes. To leave us with a solid impression of where we ended up, we’ll talk about Episode 13, in which we used a statistical model to make the moves, Episode 14, in which we had Jason Belmonte as a guest driver, and Episode 17, in which Wes Malott put up the largest set of the season.
Episode 13 – The Stats Model
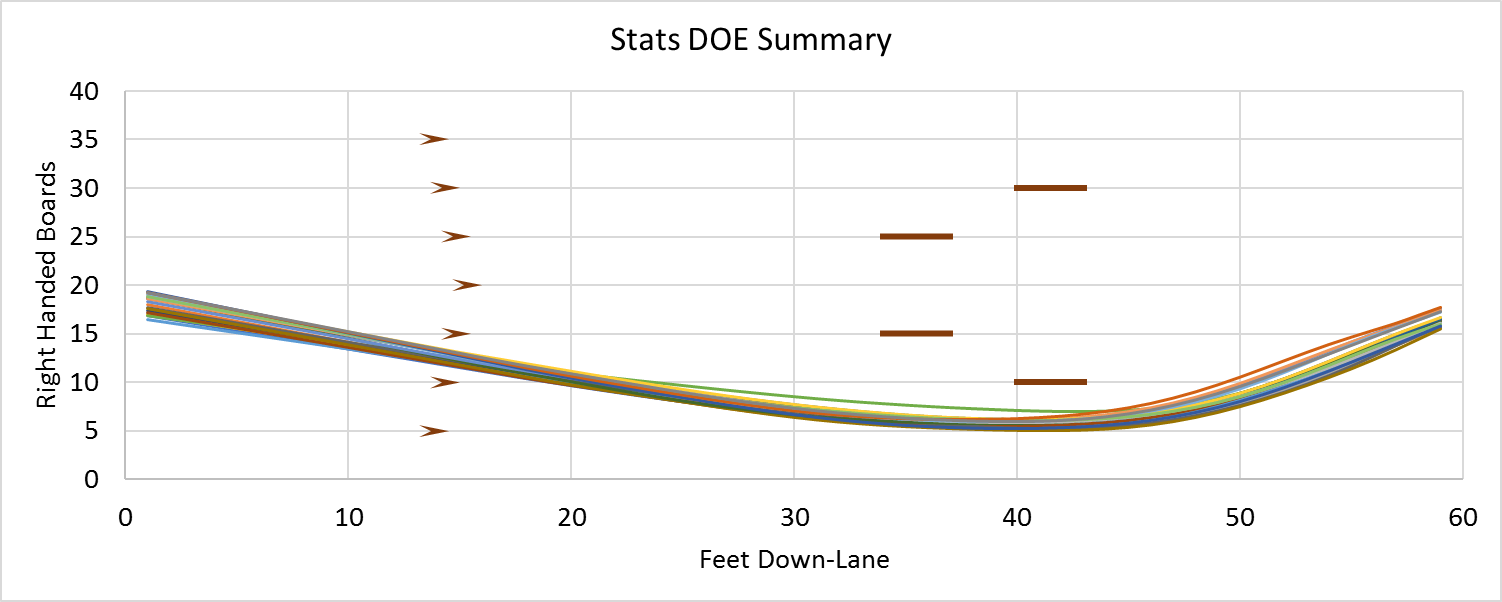
Prior to the filming of this episode, I ran an experiment known in the stats world as a DOE (design of experiments). It is a process where known key process input variables (ball speed and RPM) are varied between high and low settings and key process output variables (position at the pins and entry angles) are measured. The end result constructs a model that predicts the behavior of the ball based on the setting inputted into E.A.R.L. Using my model, I developed six lines to the pocket and we decided to move from line to line after every six shots. Below is a figure of all the shots that hit the pins between the 16 board and the 19 board according to SPECTO. Net result for our stats model was a smooth 730.
Episode 14 – Jason Belmonte Drives
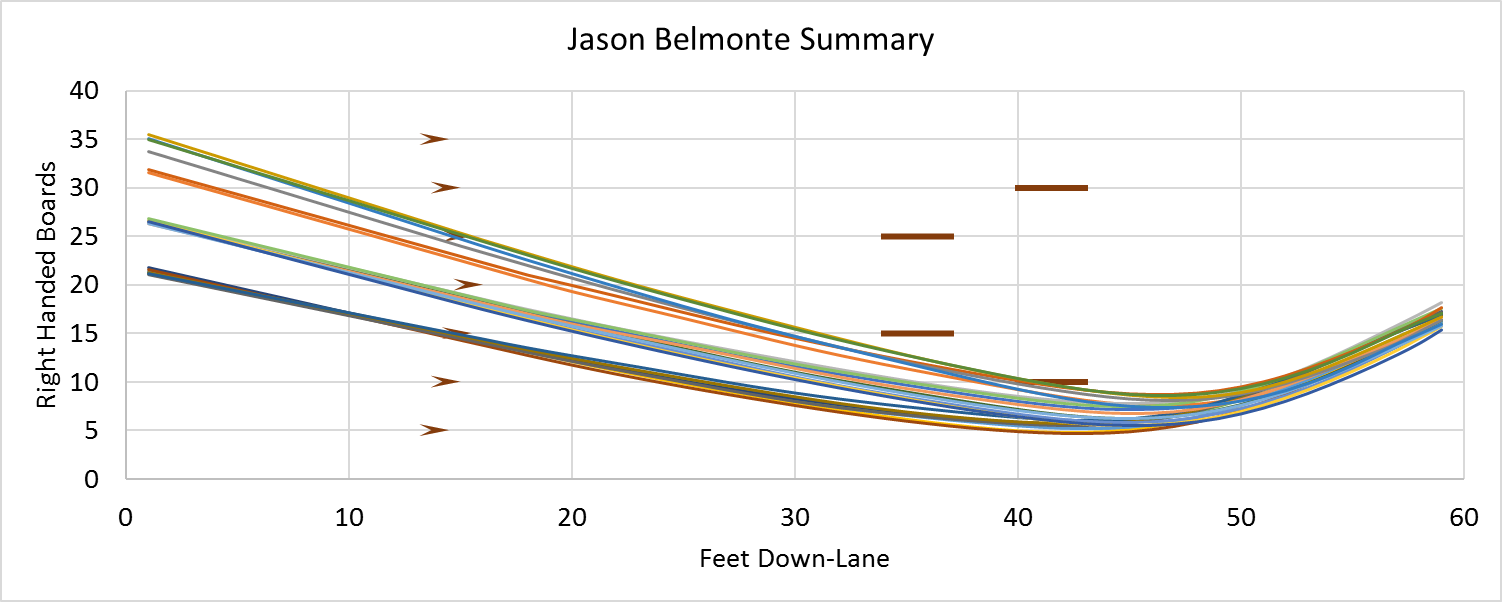
Jason came in with a very interesting strategy. He knew that in Game 3 he would have to be playing a different part of the lane than where he started the session. In practice, he lined up at the third, fourth and fifth arrows with the idea to jump from zone to zone, playing one zone per game. Unfortunately for Jason, E.A.R.L. was suffering from some mechanical issues and did not perform his best that week. Nonetheless, Jason’s unmatched ability to play patterns from different angles was really eye-opening. View the summary below to see how he was able to curve the ball back from 3 different zones and still find the pocket. Net result for Jason was an unfortunate 661.
Episode 17 – Wes Malott’s Final Swing
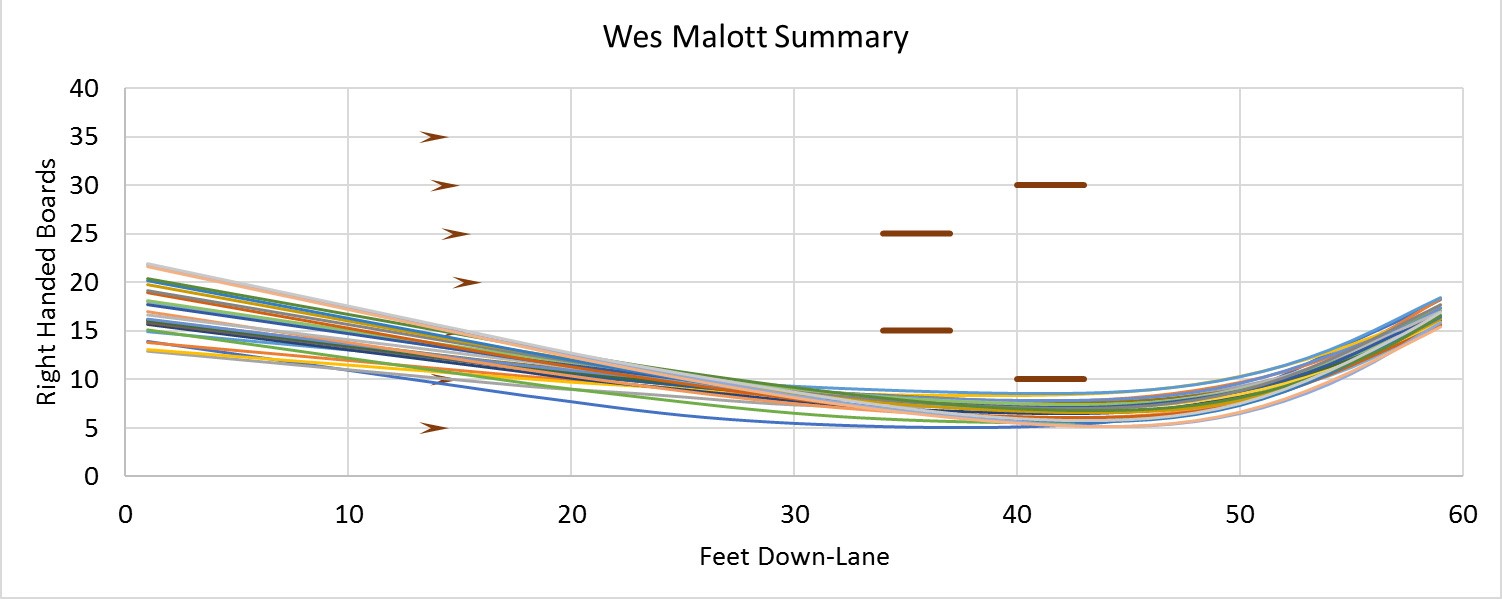
Wes Malott had the benefit of driving E.A.R.L. for three episodes, and he came out swinging all three times. In this set, he went for a more direct approach, upping the launch speed and straightening out the lines, hoping the higher energy of the ball at the pins would help carry and ultimately get him a perfect game and a perfect set.
An interesting element we learned from the Big Nasty was that he would rather see his ball leave a 4-9 split than a flat 10-pin. It’s true that flat 10s are easier to convert, but when your ball is in the zone to flat 10, it has a higher probability to flat 10, whereas being in a position to 4-9 also comes with a higher likelihood to carry. The net results for Wes was three sets of 796, 809 and 815, a combined average of 268.9! Wow, that’s big and nasty! Notice in his summary below he was not afraid to get in deeper and knew what it took to keep his angles right downlane.
Why was Wes able to average so much higher than our season average of 240.7? Let’s dig into what the data says, and hopefully, we will get a good idea of what to do moving forward.
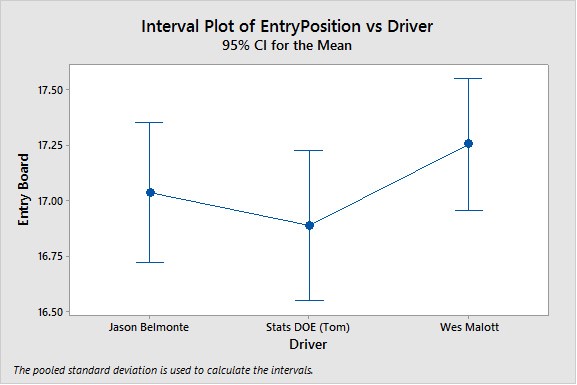
Looking at the average entry position of where each of these three drivers hit the pins, both pros tended to be just a quarter of a board higher in the pocket than our stats model.
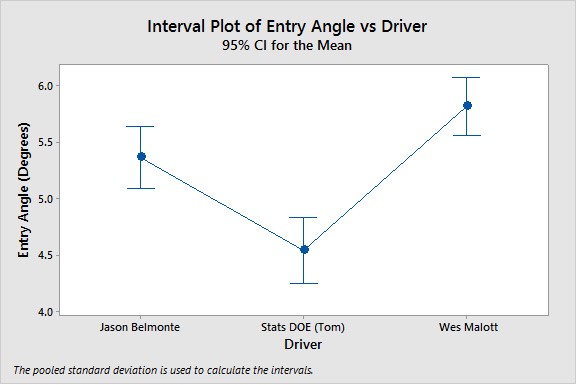
Both pros were seeking a steeper angle of entry into the pocket, around the 5.5- to 6.0-degree range, than our stats model. I don’t think it is a coincidence that our Bowlscore system predicts six to seven degrees to be the optimal angle for striking.
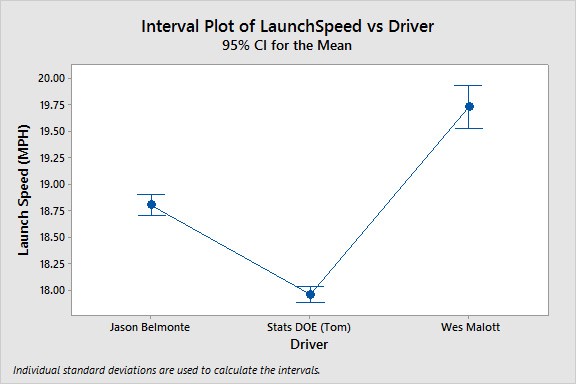
Looking at launch speeds, Wes was throwing the ball the fastest at the release point at nearly 20 miles per hour. Jason’s style came in a little slower at 19 miles per hour and our DOE was launching the ball at about 18 miles per hour.
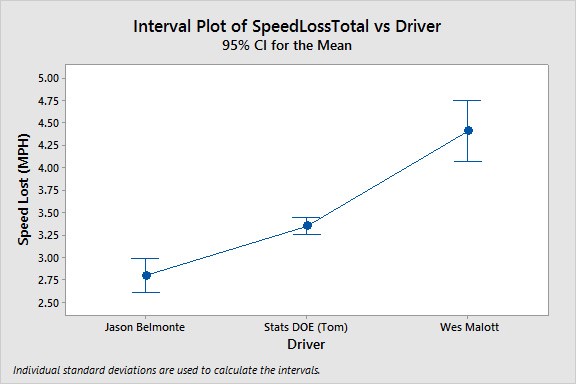
I found it very interesting that even though Wes was throwing the ball the fastest, Jason’s shots were hitting the pins at the fastest speeds. With the larger rotational speed, the ball slowed down less before arriving at the pins. Jason’s shots only lost 2.8 miles per hour on average.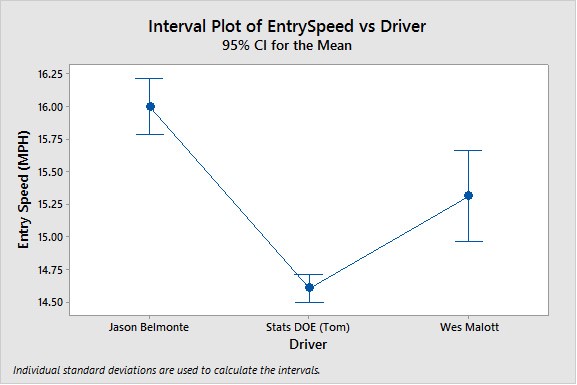
The Future
E.A.R.L.’s chances at 900 are now brighter than ever. Looking into the results achieved by the pros, our direction could not be clearer. We know our stats model is promising, but we were off target. By combining these three approaches, using a faster and more direct line, then building stats models based on playing multiple zones, we may just accomplish our biggest set yet. Maybe even shoot 900!
If you want to see our first attempt of Season 2, be sure to check out the Backstage page on BowlTV.com. We definitely learned a lot to apply to Episode 2 in May!
Tom


comments