

Recently we jumped back into E.A.R.L.’s Journey to 900, and I want to share some key details from our first episode you may have missed.

Yes, it is true. Yours truly threw the lowest E.A.R.L. set on camera to date last month. Very disappointed. But, we’re about to dive into the data behind our stats model we referenced in Episode 1 and discuss some key findings and areas to improve. So let’s get to it.
The Targeting Model
First up, I want to discuss our targeting model. We generated the model with what is known in the stats world as a three-factor response surface design of experiment (DOE, for short). How’s that for some fancy math lingo? Here is what it means. DOEs are conducted by selecting low, high, and medium values for key process input variables, and measuring the key process output variables at each combination of the settings. By throwing 30 shots with very specific settings of our input variables: Laydown Board, Launch Trajectory and Ball Speed, we were able to model the entry board into the pins as well as the entry angle. This table shows the 30 data points corresponding to our experiment.
|
StdOrder |
RunOrder |
PtType |
Blocks |
Laydown |
Trajectory |
Speed |
Entry Board |
Entry Angle |
|
1 |
1 |
1 |
1 |
15 |
-2.0 |
18.0 |
19.7 |
5.8 |
|
2 |
2 |
1 |
1 |
23 |
-2.0 |
18.0 |
16.6 |
5.1 |
|
3 |
3 |
1 |
1 |
15 |
-1.0 |
18.0 |
22.0 |
6.8 |
|
4 |
4 |
1 |
1 |
23 |
-1.0 |
18.0 |
29.0 |
6.3 |
|
5 |
5 |
1 |
1 |
15 |
-2.0 |
19.0 |
20.9 |
5.6 |
|
6 |
6 |
1 |
1 |
23 |
-2.0 |
19.0 |
17.7 |
5.4 |
|
7 |
7 |
1 |
1 |
15 |
-1.0 |
19.0 |
22.2 |
6.4 |
|
8 |
8 |
1 |
1 |
23 |
-1.0 |
19.0 |
28.3 |
7.0 |
|
9 |
9 |
-1 |
1 |
15 |
-1.5 |
18.5 |
21.9 |
6.3 |
|
10 |
10 |
-1 |
1 |
23 |
-1.5 |
18.5 |
25.8 |
6.5 |
|
11 |
11 |
-1 |
1 |
19 |
-2.0 |
18.5 |
17.5 |
4.6 |
|
12 |
12 |
-1 |
1 |
19 |
-1.0 |
18.5 |
24.7 |
6.9 |
|
13 |
13 |
-1 |
1 |
19 |
-1.5 |
18.0 |
19.6 |
5.6 |
|
14 |
14 |
-1 |
1 |
19 |
-1.5 |
19.0 |
20.4 |
6.0 |
|
15 |
15 |
0 |
1 |
19 |
-1.5 |
18.5 |
19.6 |
5.6 |
|
16 |
16 |
1 |
1 |
15 |
-2.0 |
18.0 |
19.4 |
4.6 |
|
17 |
17 |
1 |
1 |
23 |
-2.0 |
18.0 |
16.4 |
5.2 |
|
18 |
18 |
1 |
1 |
15 |
-1.0 |
18.0 |
21.7 |
6.5 |
|
19 |
19 |
1 |
1 |
23 |
-1.0 |
18.0 |
27.3 |
7.1 |
|
20 |
20 |
1 |
1 |
15 |
-2.0 |
19.0 |
21.8 |
6.0 |
|
21 |
21 |
1 |
1 |
23 |
-2.0 |
19.0 |
17.3 |
4.8 |
|
22 |
22 |
1 |
1 |
15 |
-1.0 |
19.0 |
21.7 |
5.7 |
|
23 |
23 |
1 |
1 |
23 |
-1.0 |
19.0 |
26.4 |
6.4 |
|
24 |
24 |
-1 |
1 |
15 |
-1.5 |
18.5 |
21.8 |
6.0 |
|
25 |
25 |
-1 |
1 |
23 |
-1.5 |
18.5 |
23.2 |
5.9 |
|
26 |
26 |
-1 |
1 |
19 |
-2.0 |
18.5 |
18.0 |
5.6 |
|
27 |
27 |
-1 |
1 |
19 |
-1.0 |
18.5 |
26.5 |
7.2 |
|
28 |
28 |
-1 |
1 |
19 |
-1.5 |
18.0 |
19.0 |
5.0 |
|
29 |
29 |
-1 |
1 |
19 |
-1.5 |
19.0 |
21.0 |
6.1 |
|
30 |
30 |
0 |
1 |
19 |
-1.5 |
18.5 |
20.6 |
5.4 |
Initially, the results were very promising. The data provided an accurate model where over 93% of the variation in the entry board data could be explained by the input settings into E.A.R.L. quantified by the R-sq value of 93.78%
Model Summary
|
S |
R-sq |
R-sq(adj) |
R-sq(pred) |
|
0.975465 |
93.78% |
92.15% |
89.72% |
Coded Coefficients
|
Term |
Coef |
SE Coef |
T-Value |
P-Value |
VIF |
|
Constant |
21.207 |
0.350 |
60.63 |
0.000 |
|
|
Laydown |
0.745 |
0.218 |
3.42 |
0.002 |
1.00 |
|
Trajectory |
3.225 |
0.218 |
14.79 |
0.000 |
1.00 |
|
Speed |
0.350 |
0.218 |
1.60 |
0.122 |
1.00 |
|
Laydown*Laydown |
1.882 |
0.412 |
4.57 |
0.000 |
1.19 |
|
Speed*Speed |
-1.293 |
0.412 |
-3.14 |
0.005 |
1.19 |
|
Laydown*Trajectory |
2.325 |
0.244 |
9.53 |
0.000 |
1.00 |
The following equation represents how the predicted entry board is calculated from our key inputs.
Regression Equation in Uncoded Units
|
Entry Board |
= |
-1746 - 2.540 Laydown - 15.64 Trajectory + 192.0 Speed + 0.1176 Laydown*Laydown |
For example, if one wanted to hit the pins at the 18 board when laying the ball down at the 18 board with a speed of 19 MPH then we could use this calculation to approximate the desired trajectory to be: ~ -1.9 degrees.
The design was promising in theory, but disappointing in execution. Early into the set, it was not providing us with the desired outcomes. During the episode, we noticed that E.A.R.L. was not hitting his targeted speed very well at all. Since we conducted our experiment while the camera crew was setting up the morning of the episode (before re-oiling the lanes), we wondered if that same behavior happened during the experiment. And what do you know, it sure did! The following figure shows that as we changed E.A.R.L.’s ball speed from 18 to 18.5 to 19, On average the ball speed was actually going down. In order to shoot 900, we will need to keep a closer eye on this behavior, and perhaps choose to bowl at speeds where E.A.R.L. is more predictable.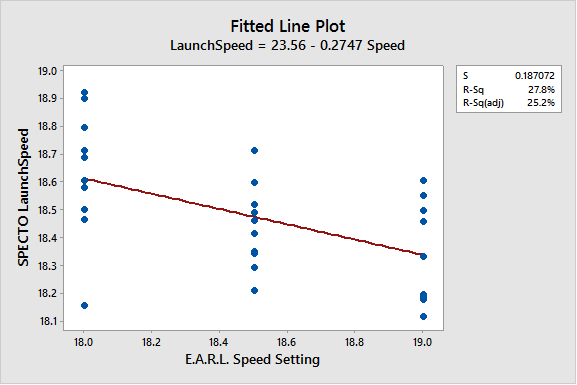
We went ahead and performed this same analysis on the launch angles to make sure those we behaving as expected. In this area, E.A.R.L. was performing much better (see the following figure).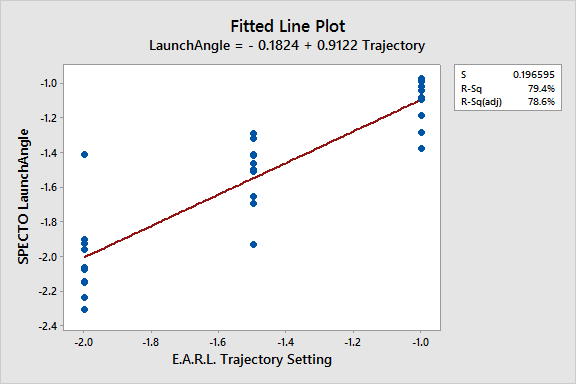
This figure is much closer to what we would like to see. In an ideal world, the equation at the top would be LaunchAngle = 1.000 * Trajectory with an R-SQ of 100%. But we don’t live in an ideal world and our robots and measuring systems are not perfect. I was able to get a good approximation of E.A.R.L.’s launch angle standard deviation and it was ~0.200 boards. This means E.A.R.L. is liable to miss by more than one board at the arrows either way once in every 10 shots. From a shooting 900 perspective, this means there will be three to four balls that may be largely off target during a set. We’re going to need a little luck to get there.
I plan to revisit this DOE methodology again with different parameters. This last attempt was good, but as you can see below, many of the 30 shots were nowhere near the pocket.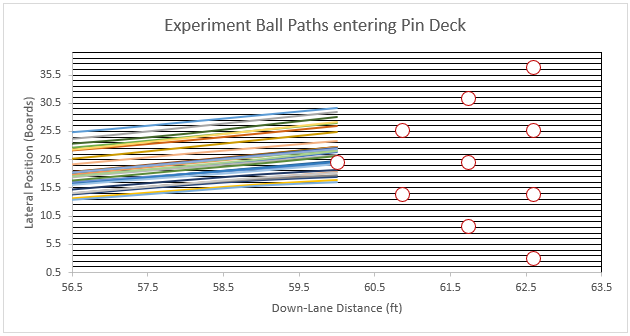
To correct this, instead of using the launch trajectory variable, I intend to use a relative trajectory from the line to a desired breakpoint. For example, if you want to get the ball to a breakpoint on the 7 board at 42 feet, you have to assume it is going to hook a couple boards in the oil over that long of a distance. If we predict the straight line between our laydown board and the 5 board at 42 feet, that will give us a baseline trajectory to get to our breakpoint. Then, we can design misses left and right of that line, realizing the baseline direction needs to change when are laydown board changes. This slight change in methodology will help us determine the optimal location for maximum room-to-miss. After doing the math, it turns out a 5 board move corresponds with a -0.60 degree change in trajectory. In bowler terms, a 5 and 3 board move left, achieves precisely the same 42-foot breakpoint.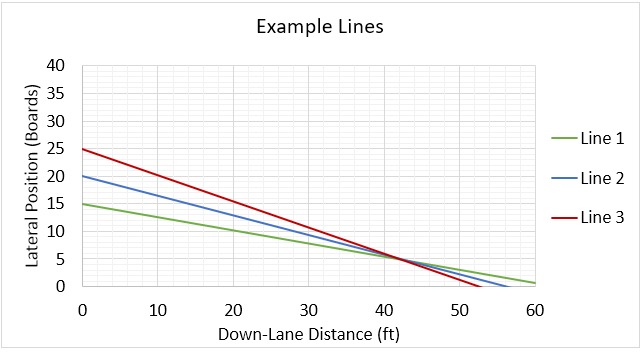
Recap
Episode 1 was without a doubt a failure in our goal of achieving 900, but failures are always the best teachers to learn how to improve. After breaking down the data, we have learned more about E.A.R.L.’s ability to repeat shots and have a better understanding of what it will take to get to 900. After a hard-fought struggle, we ended on a run of six strikes out of eight attempts after making a significant style adjustment. Join us live on BowlTV this Monday, May 6, as E.A.R.L. gets to take his second attempt at perfection, with an updated targeting model designed around our more effective style.
See you on the lanes!
Tom
Season Stats:
|
Episode |
Games |
Pins |
X% |
/% |
O% |
High Game |
High Series |
|
Ep.1 |
3 |
645 |
48.6% |
45.7% |
5.7% |
221 |
645 |
|
Season |
3 |
645 |
48.6% |
45.7% |
5.7% |
221 |
645 |

comments